User Activity In Jira Dashboards
You can view the user activity reports via Jira Dashboards, using the app gadgets.
This feature is available from the version 1.0.38-AC (15-Nov-2024). If you use any previous version, please update the app through UPM to enable the gadgets.
You can add gadgets for the Aggregated View ; Inactive Users ; User Activity Feeds into the Jira Dashboard, follow the following steps:
In the left-side navigation menu, find “Dashboards” and click the “+” button to create a new dashboard.
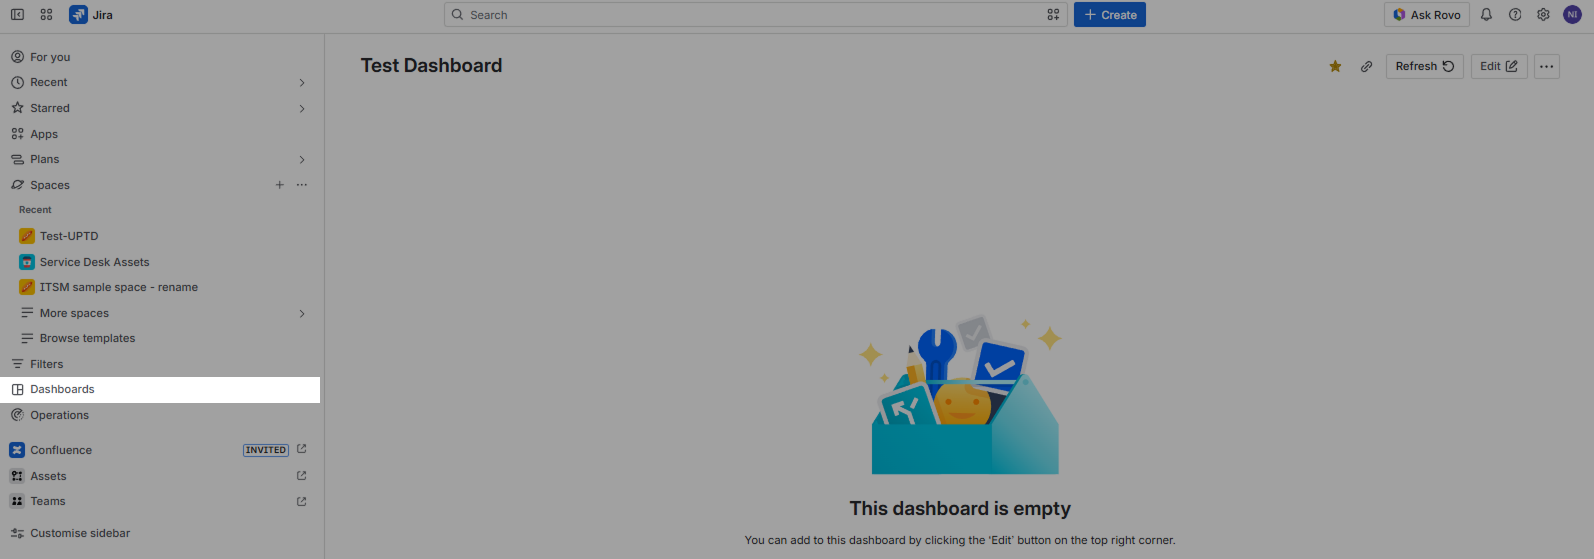
A popup will appear where you need to fill in the following fields: Name, Description, Viewer, and Editor:
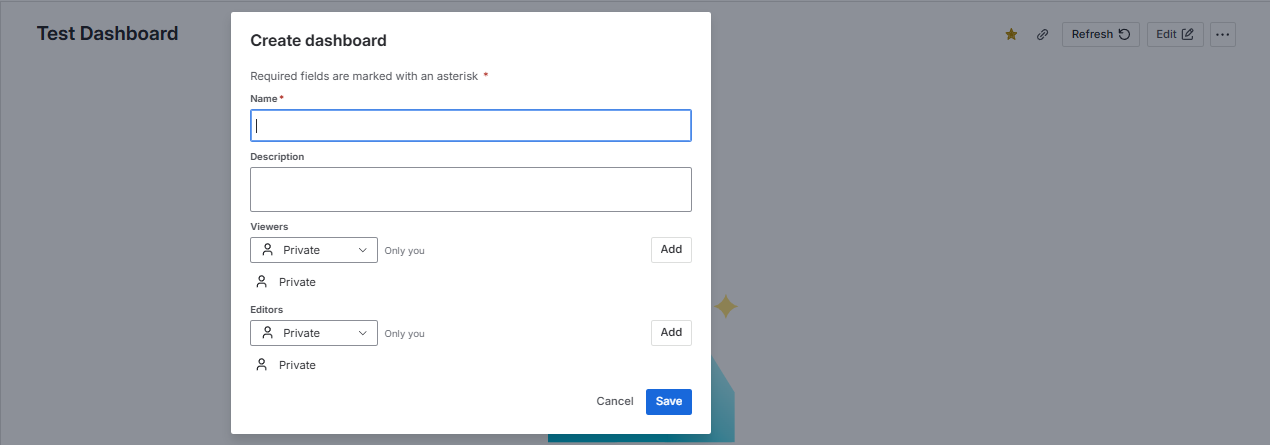
Once you create the dashboard using the popup, it will appear in the dropdown menu.
To modify the created dashboard, select the added dashboard and click the “Edit” button located in the top-right corner. After that, the “Add a Gadget” section will appear, where you need to enter “User Activity” in the search bar. As a result, you will see three available gadgets: Aggregated View ; Inactive Users ; User Activity Feeds
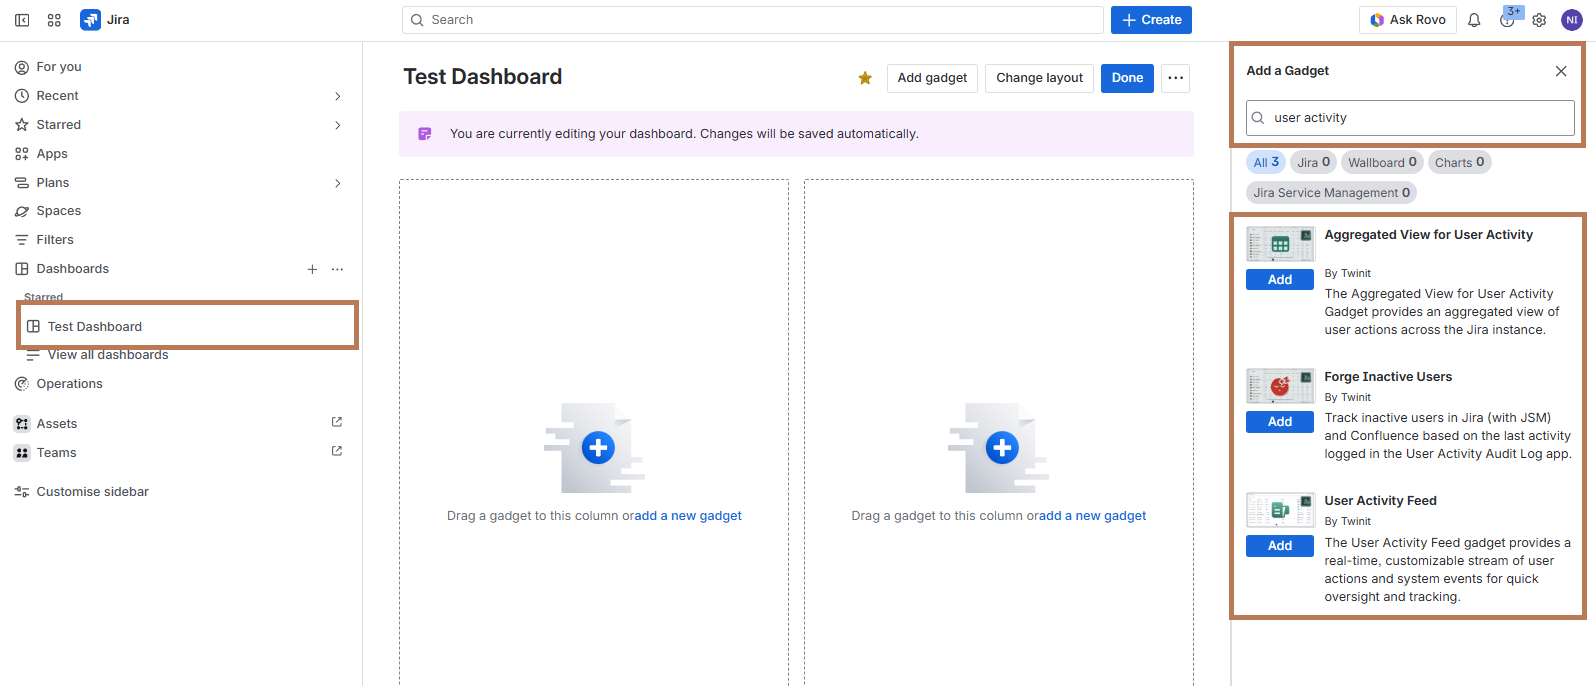
To add any of these three gadgets, click the “Add” button on the corresponding gadget. After that, the gadget configuration settings will be displayed.
1.Aggregated View
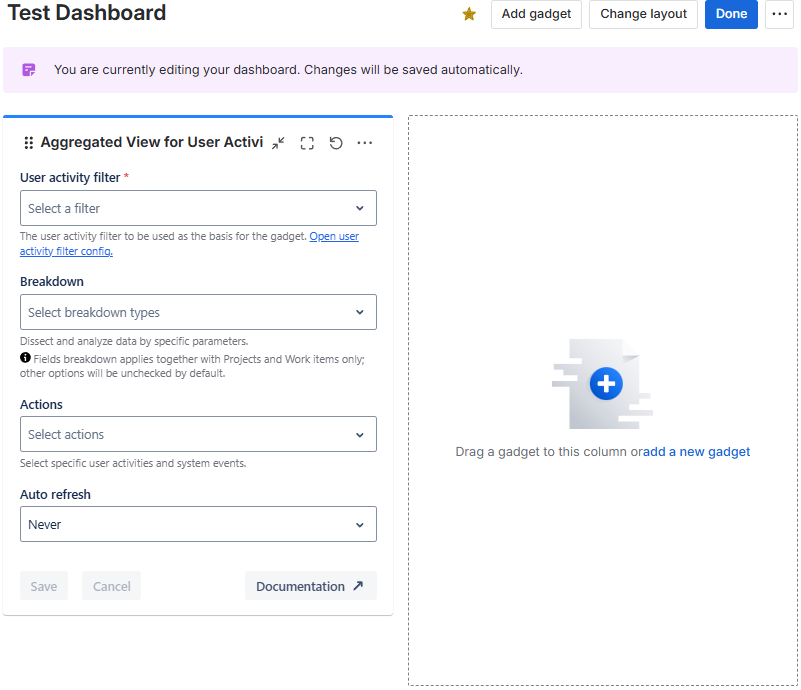
After the gadget is added, you will see the gadget configuration fields:
User activity filter
- From the dropdown, you need to select a saved filter from the app. From here you can directly navigate to the User Activity Log app to configure and save the filters.
Breakdown
Select the parameters you need to breakdown the logs. If no parameters are selected the dashboard will show the view without any breakdown:
Project
- You will see the actions, across the user, for specific projects. Non-project-related activities will be shown in a separate row - Non-project activities:
Status
- Select Status to break the actions down by the destination status to see how many times the user transitioned the work item into the statuses:
Transition
- Select the transitions to break the actions down by the transitions to see how many times the user transitioned the work item from one status to another.
Work Item
Select this if you what break the action by the work items.
- If the work item breakdown retrieves more than 100 work items, you will see the actions for 100 work items and the corresponding notification. In such case, you will need to refine the criteria in the filter:
You can combine breakdown by work items with breakdown by project, status, and transition:
Fields
- Select “Fields“ if you want to break the actions down by the fields that were updated. You can see the log only for the fields added to the Fields monitoring, after the date when the fields were added to the monitoring.
- You can combine the breakdown by fields only with Project and work items. If Status and/or transition was selected in the Breakdown dropdown, clicking Fields will unselect those options.
Actions
- Select actions out of more than 80 available actions to view in the results. When you select the filter, the actions that are configured in the filter will be automatically filled in. You can further add or remove the actions
Auto refresh
- Select how often do you want the dashboard to be updated. Please keep in mind that for the large amount of data, the update may take time.
When you fill all the fields in, click the “Save“ button to view the results.
If you use JQL search in your saved filter and the results retrieve more than 1,000 work items, you will see the actions for 1,000 work items and the corresponding message in the results:
When the breakdown is selected, sorting of the columns in the results will be disabled.
You can add more than one gadget on the dashboard with various configurations!
2.Inactive Users
This gadget is available from version 1.0.45-AC (16-Jan-2025). If you use any previous version, please update the app through UPM to enable the gadget.
To add the gadget “Inactive Users” into the Jira Dashboard, follow the following steps:
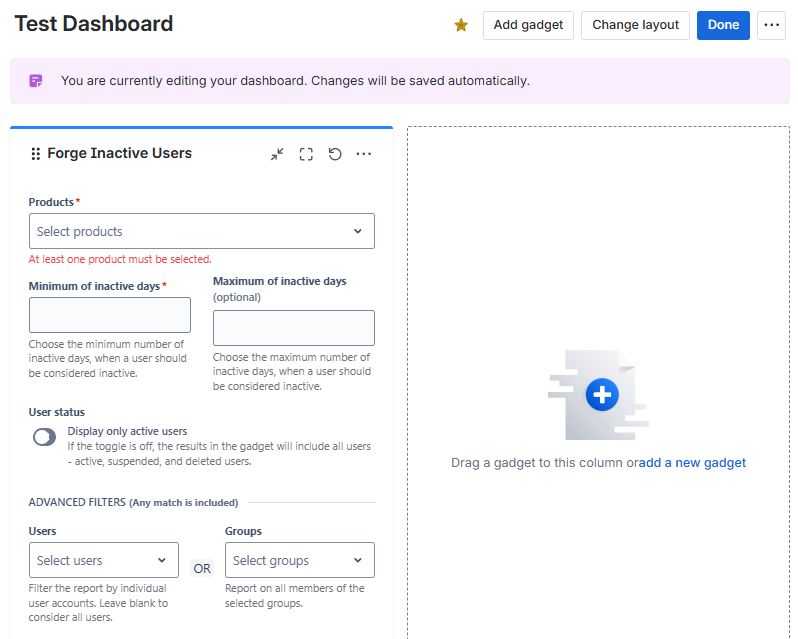
After the gadget is added, you will see the configuration details:
Products
Choose Jira and/or Confluence.
Minimum of inactive days (mandatory field)
- Choose the minimum number of inactive days, when a user should be considered inactive. For example, if you enter “10”, in the results you will see the list of the users who have been inactive in the product for 10 or more days. If you enter “0“, the results will also show users who have been inactive for today.
Maximum of inactive days
- Choose the maximum number of inactive days, when a user should be considered inactive. For example, fn you enter if you enter “10” as a minimum of inactive days and enter “100” here, the list will show the users who have been inactive in the product for more than 10 and less than 100 days.
- Maximum of inactive days number cannot be less than the minimum of inactive days.
User Status
- Here you can define whether to show only active users in the results or also deleted and suspended users.
‘Users’
- Filter the report by individual user accounts. Leave blank to consider all users.
OR ‘Groups’
- Report on all members of the selected groups.
You can sort the data with every column. Each page shows 5 users per page.
If the User Activity Audit Log app license is expired, you will see the corresponding notification in the gadget. In such a case, please purchase a valid subscription from the Atlassian Marketplace.
3.User Activity Feed
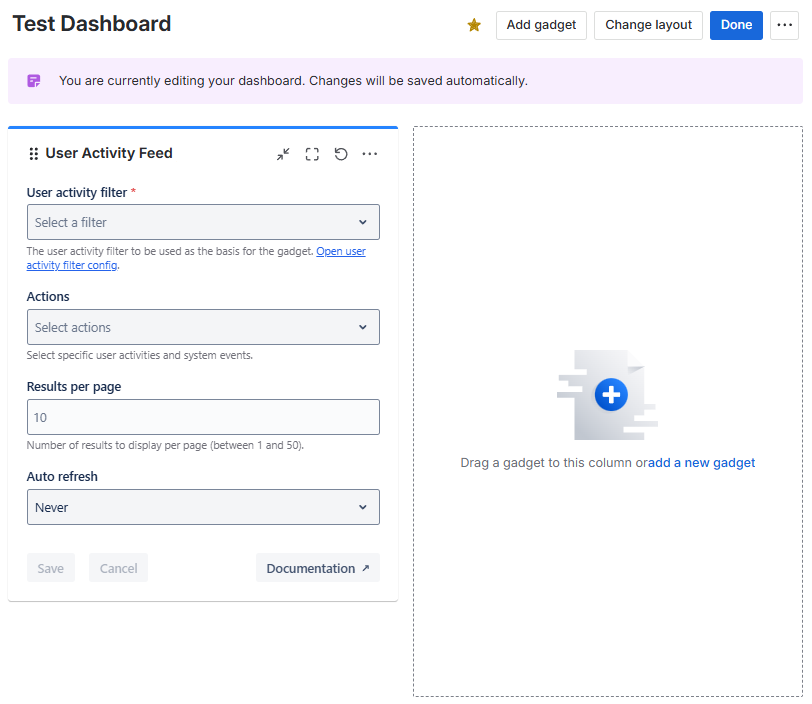
After the gadget is added, you will see the gadget configuration fields:
User activity filter
- From the dropdown, you need to select a saved filter from the app. From here you can directly navigate to the User Activity Log app to configure and save the filters.
Actions
- Select actions out of more than 80 available actions to view in the results. When you select the filter, the actions that are configured in the filter will be automatically filled in. You can further add or remove the actions.
Results per page
- Number of results to display per page (can be between 1 and 50).
Auto refresh
- Select how often you want the dashboard to be updated. Please keep in mind that for the large amount of data, the update may take time.
When you fill all the fields in, click the “Save“ button to view the results:
The information available in the Detail View of the app is also available in the gadget.
You can expand all the details of the actions By clicking the “Expand all“ button:
To download the results in the .xlsx format click the “Export (.xlsx)“ button in the gadget:
If you use JQL search in your saved filter and the results retrieve more than 1,000 work items, you will see the actions for 1,000 work items and the corresponding message in the results:
You can add more than one gadget on the dashboard with various configurations!