Dashboards
Welcome to Dashboards , a feature area of the User Activity Audit Log app which helps teams turn raw audit events into visual insights. It is designed for fast monitoring, auditing, trend analysis, and operational review. You can access this page by selecting Dashboards from the sidebar dropdown menu:
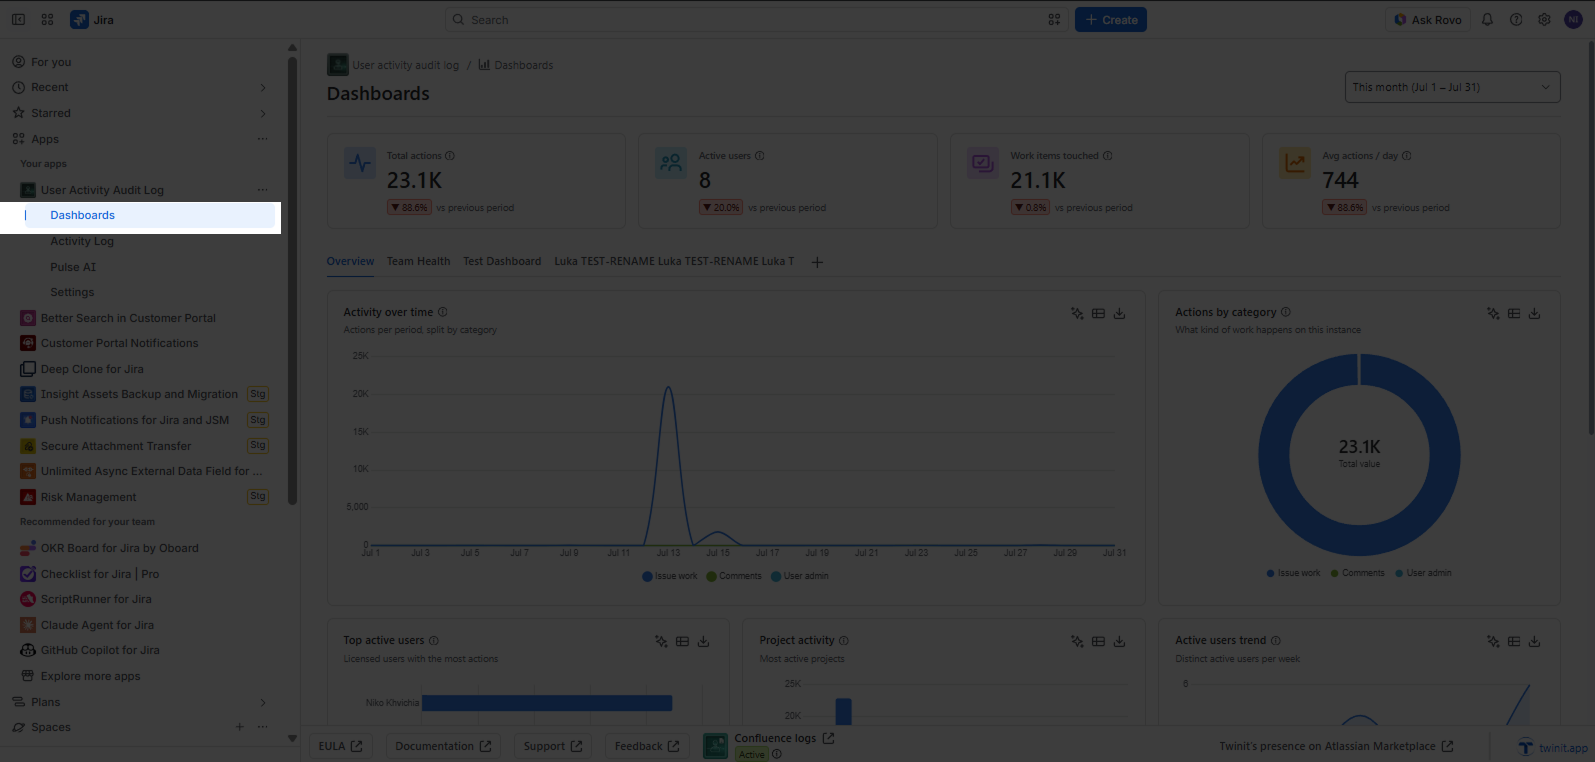
Dashboard data does not include “Work Item View” and “User Last Active” information.
Dashboard Filters & Custom Chart
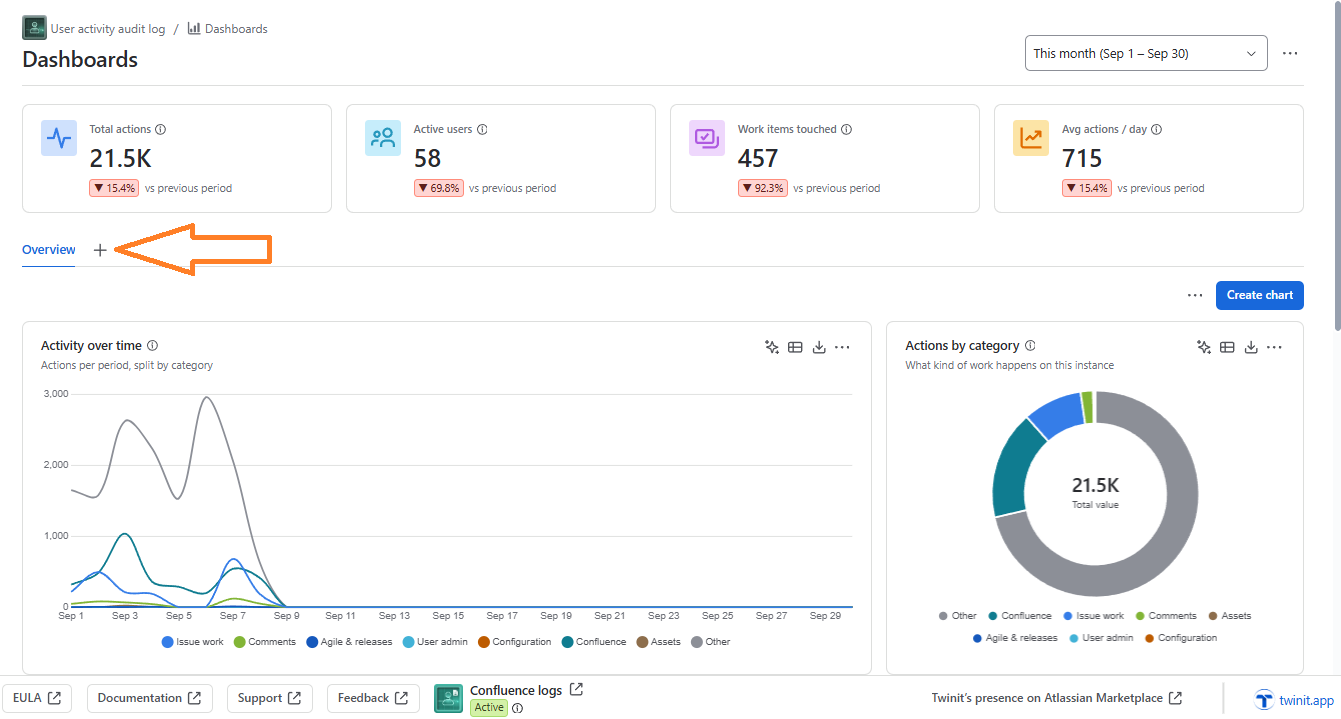
The Dashboards page provides global filter controls at the top of the page that allow you to refine and narrow down the audit log data displayed across all visualizations. To do so, click the plus icon to add a new tab:
Give a name to your new tab:
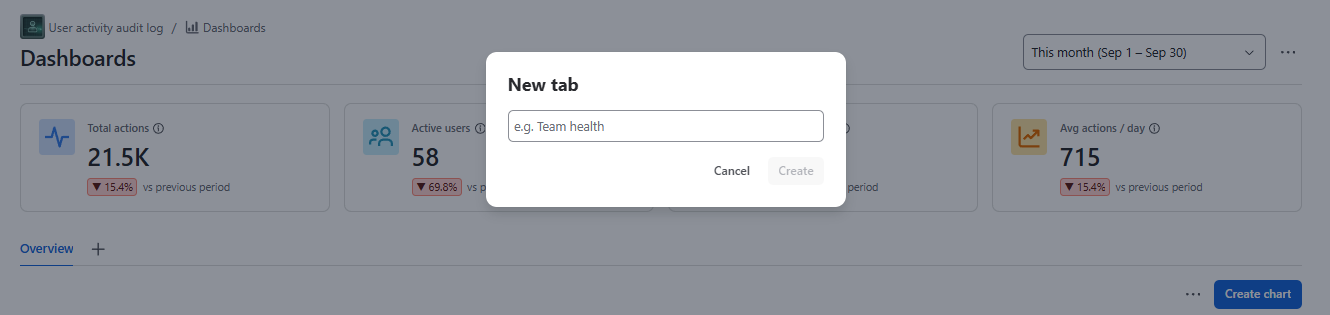
Once you have created a new tab click “Create Chart” button

Then you can configure and build a custom chart:
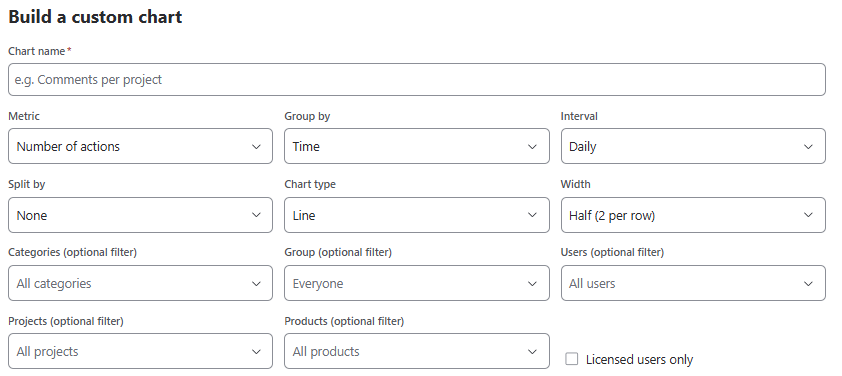
Chart name
Metric
- Number of actions
Distinct active users
Distinct issues touched
- Number of actions
Group by
- Time
- Project
- Action category
- Action type
- Issue type
- Weekday hour (heatmap)
Interval
- Daily
- Weekly
- Monthly
Split by
- None
- Action category
- Action type
- Project
- Issue type
Chart type
- Line
- Bar
Width
- Third (3 per row)
- Half (2 per row)
- Two thirds
- Full width
Categories (optional filter)
- Issue work
- Comments
- Worklogs
- Views
- Agile & releases
- Project admin
- User admin
- Configuration
- Confluence
- Assets
- Other
Group (optional filter)
- Filter data to include activity performed only by members of selected Jira user groups (e.g., Jira Administrators, Developers, or custom groups).
Users (optional filter)
- Focus on individual team members to review their activity levels and contributions.
Projects (optional filter)
- Limit the dashboard data to one or multiple specific Jira projects.
Products (optional filter)
How Global Filtering Works
When you apply a filter by User Group, User, or Project, all charts and gadgets on the page automatically refresh to reflect your selection. This allows you to evaluate team-specific engagement, audit project activity, or investigate individual workload trends seamlessly.
Activity Over Time
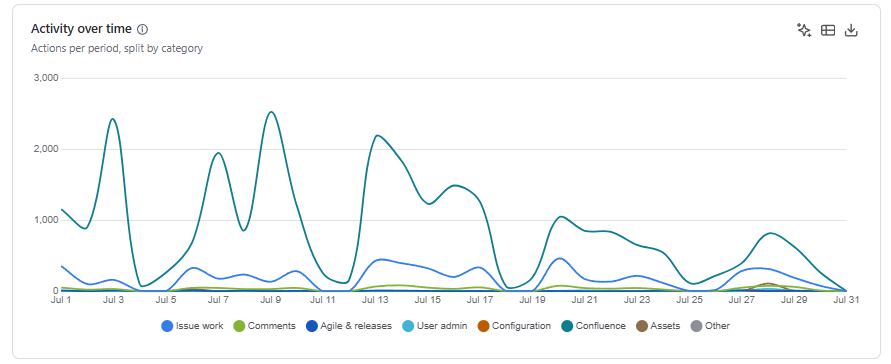
Activity Over Time shows a total number of user actions (creates, updates, comments, transitions) plotted over a time range (daily, weekly, monthly).
When To use:
- You want to spot unusual spikes or drops in activity (e.g., a sudden surge might indicate bulk changes or automation gone wrong)
- Tracking team productivity trends over sprints or quarters
- Auditing whether activity patterns changed after policy or workflow updates
Top Active Users
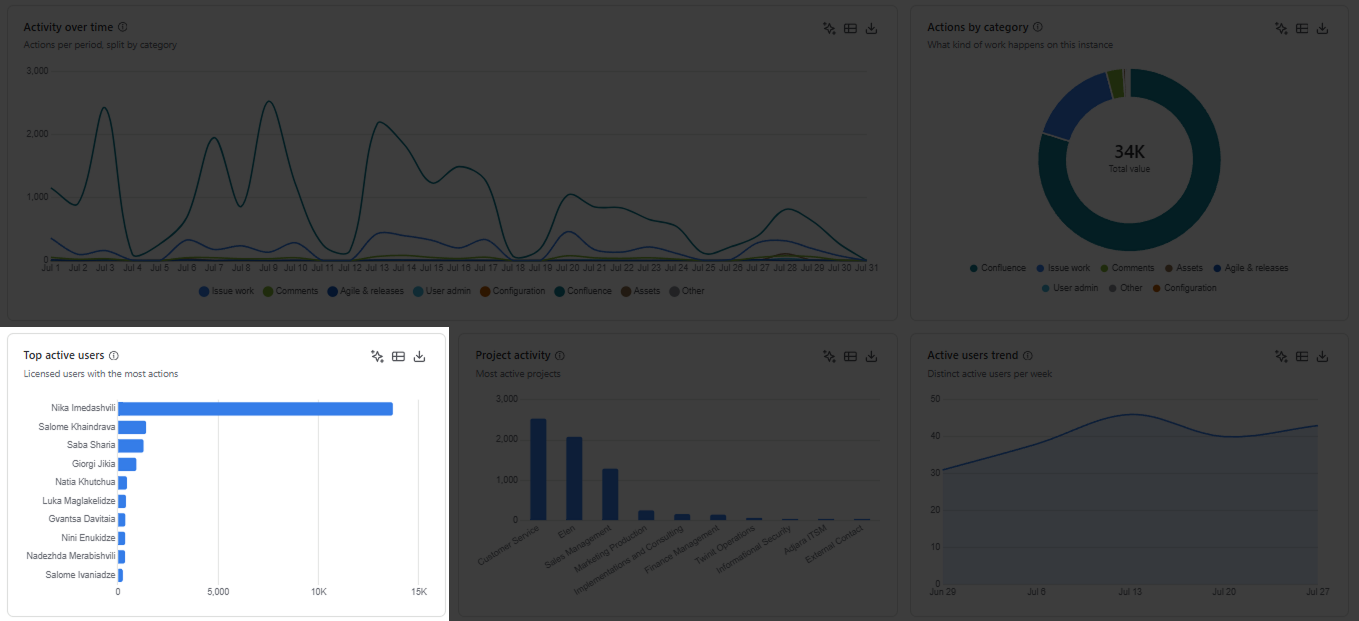
Top Active Users shows a list or bar chart of the users with the highest total action count within the selected time range. Each bar (or row) represents a user, ordered from most to least active.
When To Use:
- Recognizing top contributors during a sprint or review period
- Identifying who is driving the most activity across projects
- Spotting unusually high activity from a single account (e.g., a bot, automation, or a bulk-edit event)
- Supporting performance reviews or workload assessments with objective data
- Auditing for compliance — confirming that expected users are active and unexpected ones are not
How it works: The chart aggregates all logged actions (creates, updates, comments, transitions, etc.) per user and ranks them in descending order. You can scope the chart by date range, user group, user, or project using the dashboard filter bar.
Project Activity
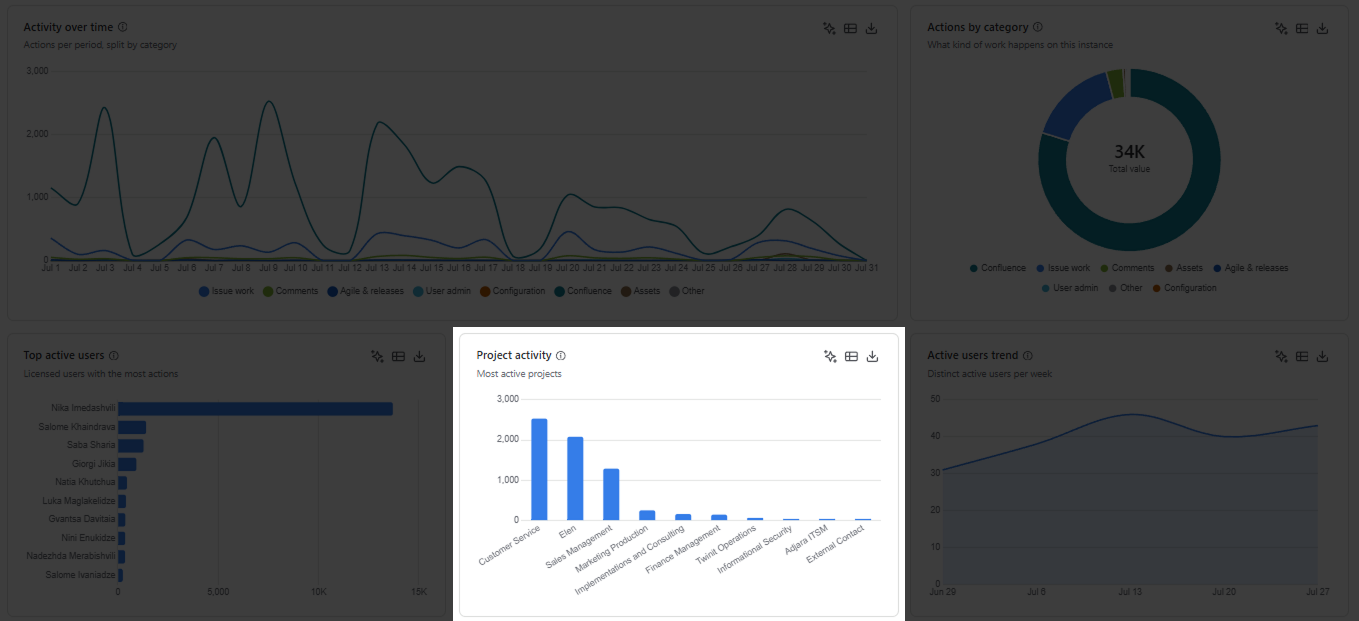
Project Activity shows the distribution of user activity across different Jira projects.
When To Use:
- Determining which projects are getting the most attention
- Identifying neglected or stale projects with low activity
- Planning resource allocation based on where work is concentrated
- Cross-project auditing for compliance
Actions By Category
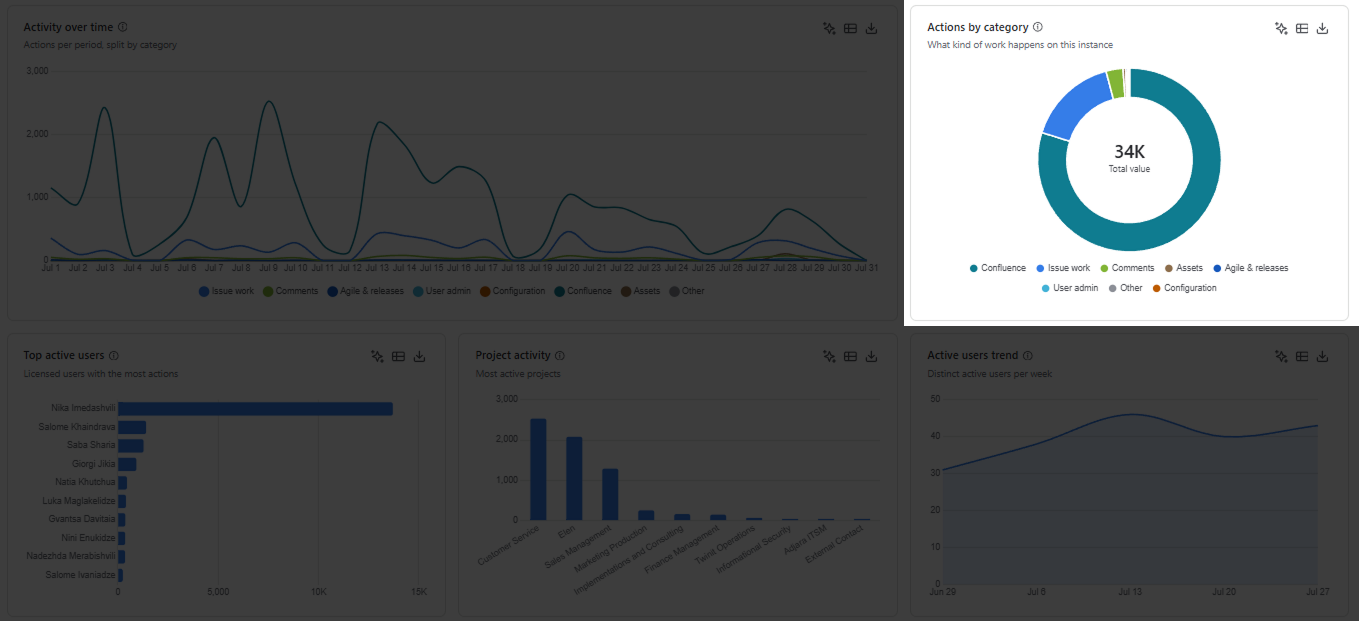
Actions By Category shows a breakdown of all logged actions grouped by their category — such as Issue Actions, Comment Actions, Attachment Actions, Workflow Transitions, Field Changes, Sprint Actions, etc. Typically displayed as a pie/donut chart for proportional view or a bar chart for absolute counts.
When To Use:
- Understanding the nature of work happening in your instance — is the team mostly creating issues, commenting, or transitioning statuses?
- Identifying process bottlenecks — e.g., a disproportionately high number of transitions may indicate issues bouncing between statuses
- Auditing specific action types — e.g., checking how many deletions or permission changes occurred in a given period
- Reporting on team collaboration patterns — high comment/attachment ratios suggest active discussions
- Spotting anomalies — an unusual spike in bulk deletions or field changes may warrant investigation
Active Users Trend
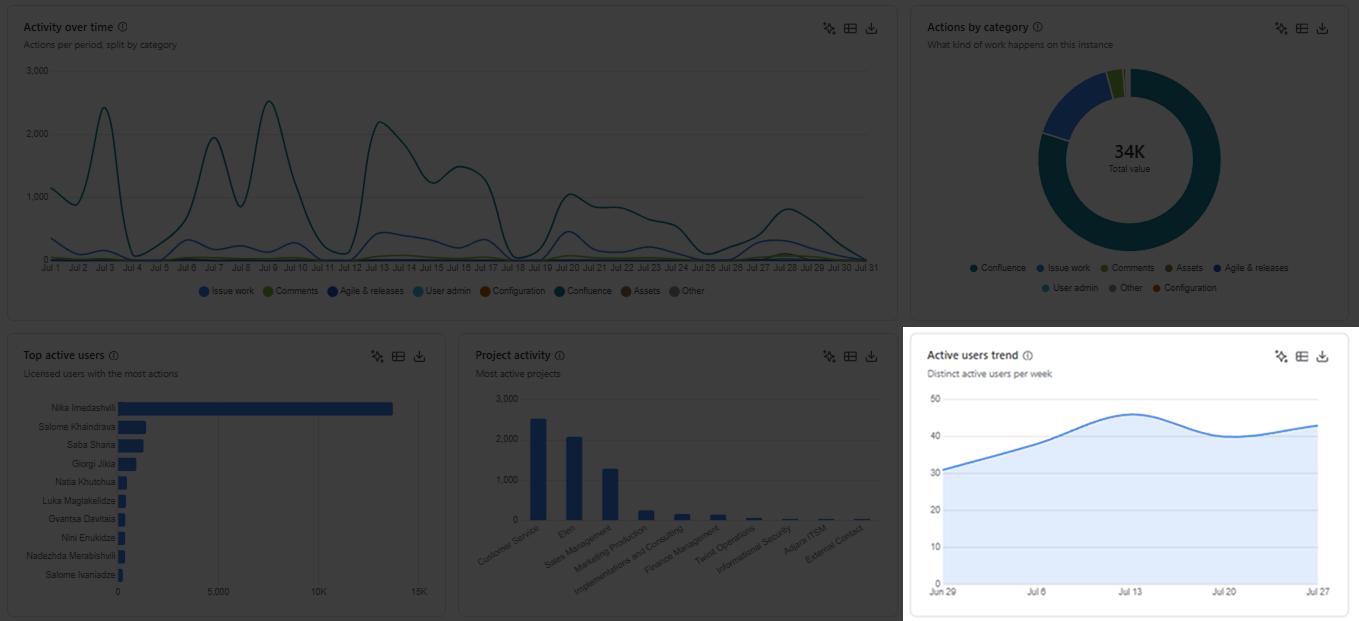
Active Users Trend show the time-series visualization of the number of distinct active users per day, week, or month over a selected period. Each data point represents how many unique users performed at least one logged action during that time interval.
When To Use:
- Tracking adoption and engagement over time — are more (or fewer) users actively working in the instance?
- Identifying seasonal patterns — e.g., dips during holidays, spikes at sprint starts or end-of-quarter
- Measuring the impact of onboarding — after adding new team members, you should see the trend rise
- Detecting unusual drop-offs that may indicate access issues, tool migration, or disengagement
Activity Heatmap
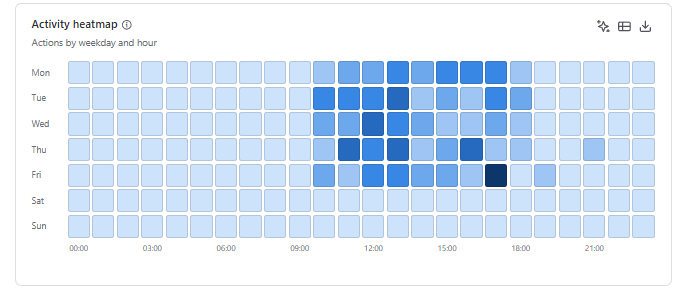
What it shows: A grid showing activity intensity by day of week and/or hour of day.
When To Use:
- Identifying peak working hours for your team
- Detecting after-hours or weekend activity (useful for security or overtime monitoring)
- Planning maintenance windows during low-activity periods
- Understanding work patterns across time zones (relevant if you’re collaborating with distributed teams)